Portfolio
🤖 Predictive Analytics: Machine Learning with Python
Loan Default Prediction
Business problem: Banks boost the bottom line by providing loans to as many customers as possible. The interest income generated from each loan, however, is just a small proportion of loan amount so if a customer defaults, the bank will incur a huge loss. How can banks know which customer will default so they make better decision on loan approval?
Proposed solution: One approach is to leverage customer and loan application data to build machine learning models predicting which customer is going to default. With those insights, the bank can make better decision on loan approval.
Notebook: Loan Default Prediction code
Conclusion:
- AdaBoost outperforms other models based on AUC and would be used to predict probability of default for new loan application and guide approval decision.
- The model also indicates top 10 important features affecting default probability. With these insights, banks can focus on those features of customers to maximize loan amount to boost profit while managing credit risk.
Customer Churn Prediction
Business problem: Customer retention is key to sustainable growth for subscription-based businesses since the cost of retaining existing customers is much less than acquiring new ones. Therefore, identifying factors that affect customers’ decision on canceling subscriptions is becoming increasingly crucial for these firms.
Proposed solution: My goal is to develop a prediction model that helps identify customers that are likely to discontinue their services so that those firms can take necessary actions to retain their current customers.
Notebook: Customer Churn Prediction code
Conclusion:
- XGBoost that outperforms other models based on AUC should be used to predict probability of customer churn based on customer’s usage data.
- The model points out top 10 important features affecting probability of customer churn. With these insights, subscription-based firms can detect customers that are going to churn in order to figure out ways to retain them. This expects to improve the customer retention rate and boost the bottom line.
✨ Prescriptive Analytics
Delivery Optimization
Business problem: Delivery optimization plays a vital part in creating competitive advantages and minimizing cost for retail firms. When taking orders from customers, how do those firms select one among thousands of nationwide warehouses to collect goods and deliver?
Proposed solution: Based on address of customer and warehouse, select the warehouse closest to customer destination to take goods and deliver.
Notebook: Delivery Optimization code

Conclusion: The algorithm helps pair each customer to the closest warehouse. Based on this model, the retail firm can optimize delivery to cut cost and enhance profit.
📈 Data Visualization with Tableau
Flight Delay
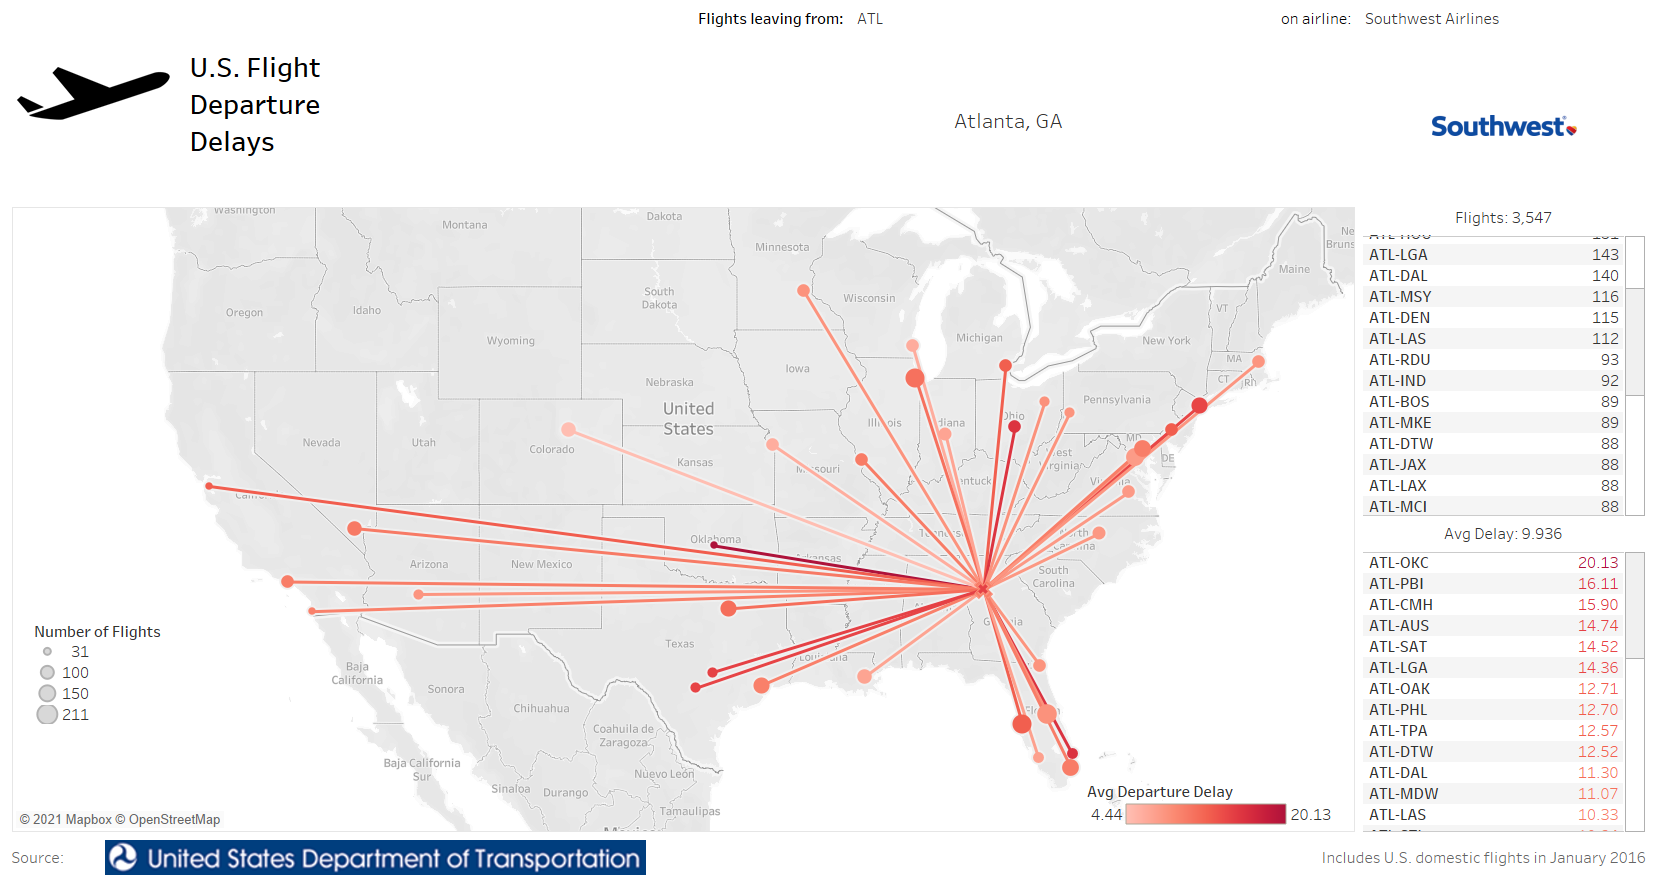
Business problem: Online travel agencies often want to evaluate and compare performance of the US major airlines so they can offer recommendation to users. This sort of data can be extracted from the U.S. Department of Transporation website but the data set is very large and thus difficult to see insights.
Proposed solution: Data visualization provides an accessible way to understand data, see trends and patterns. Tableau dashboard is the way to go.
Dashboard: Flight Delay workbook
 Image of the dashboard
Conclusion: With this dashboard, users can easily and quickly compare performance of major airlines across various airports.
Housing Affordability
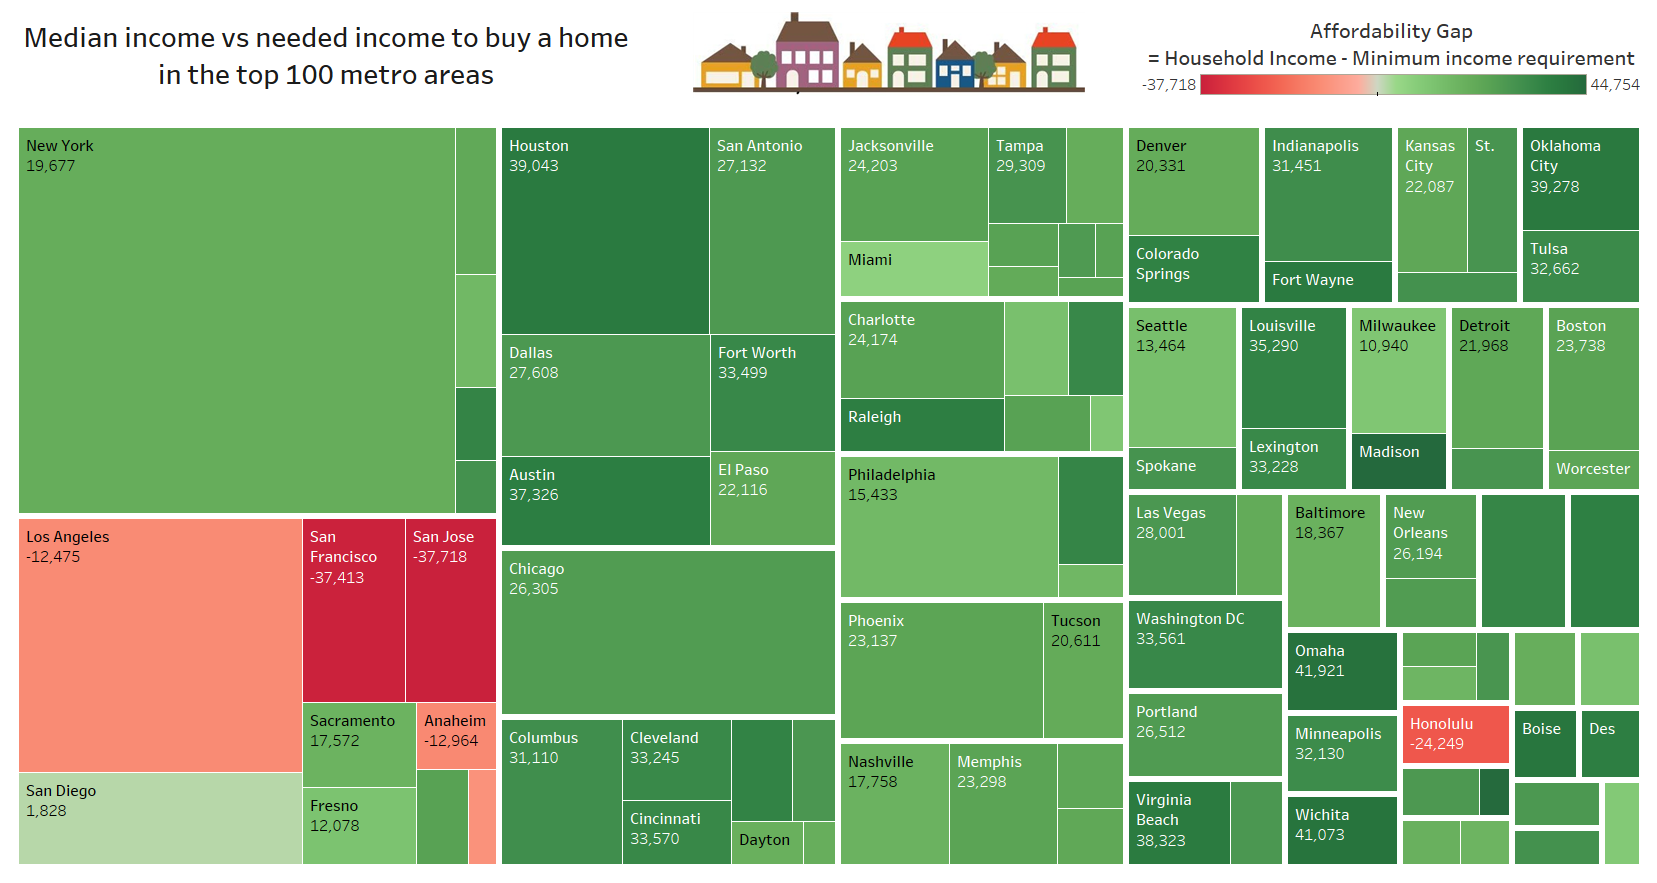
Business problem: First-time homebuyers usually seek for real estate agents’ recommendation or advice. The data on the affordability of housing is always available but agents need to make big data like this one easier for clients to understand, compare and detect patterns.
Proposed solution: Data visualization with Tableau is a great tool to achieve this goal.
Dashboard: Housing Affordability workbook
 Image of the dashboard
Conclusion: With this dashboard, users can easily get the insights and compare housing affordability across 100 metro areas in the US. Also, real estate agents can quickly input new data and Tableau will automatically update the dashboard.

